Analyzing SpyEye Malware for Fun
This is kind of a shot in the dark when it comes to content. As with most of my blog, this is mainly for my own tracking and edification but I hope to provide something adequate for others. This is a subject matter I’ve been trying to break into for a while but have been struggling for quite some time. It’s definitely out my realm of comfortability, but I’m hoping this blog will help with that.
This blog will be looking at some of the characteristics I found when analyzing one of the samples for the SpyEye malware that was commonly distributed with the Zeus banking trojan. I obtained the sample from this repo.
As a side note, that aforementioned Github repo is an amazing resource for malware samples, albeit some of the samples are pretty old. This can be a plus for people like me who are still starting out, since there will be more than likely reports written about these samples from real professionals.
I’ll mainly be looking at this malware statically using Cutter for now. I’ve taken the SANS FOR610 class, so I know of some of the other basic tools and techniques I could have used, but really I’m just trying to get more and more comfortable with code flow within decompilers, rather than practicing tradecraft of professional malware analysts. If I decide to get deeper into this part of security, I might try to adhere more, but for now let’s just poke around and see what is going on with this binary.
Let’s get into analyzing!
First Look
When loading up this sample in Cutter, we can see that the function names have been stripped, but Cutter was able to figure out the entry function of this binary as seen below.
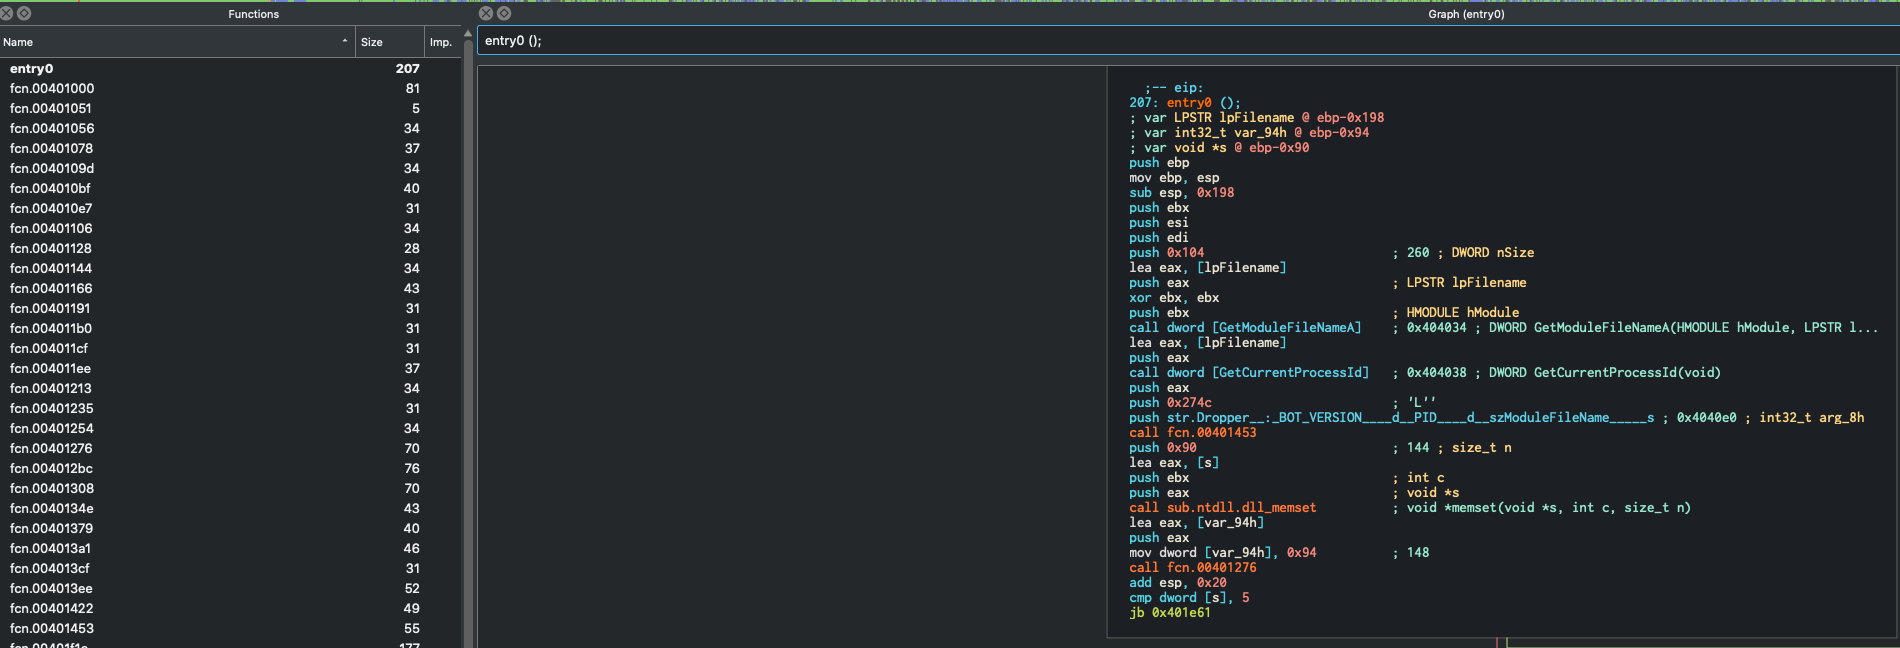
As seen from the left hand side of the screenshot above, there quite a bit of functions detected, but we will try to only focus on the relevant ones. The graph in the middle is the code graph that allows you to follow the code flow of the program, focusing on one fucntion at a time. So the one currently up is the entry() function, which in theory is what will be run as soon as the binary is initialized and run on a target system.
Most decompilers can look super intimdiating (and I am still trying to get away from becoming overwhelmed when working in them), but there is a pretty significant amount of stuff we can kind of glance over and come back to if need be. The joy for me about this kind of analysis, is that you don’t, and probably will never, fully understand what a sample does. Not only is there not enough time in the world to do this kind of analysis, but more malware analysis is done within a day or two. Analysts will basically try and find the major functionalities and identifiers of a piece of malware so not only do they know the extent of what the malware can do, but also can develop signatures so that if it ever enters their customer environment again, it will get detected.
Let’s move down the entry function and see what gets run first.
Luckily for us, the malware developers left us some handy strings, as seen in the screenshot below:

Looking at the decompiler on the right hand side, We can deduce that it attempts to create a mutex on the system. Looking at the code flow, if the mutex already exists (this means the malware is already running on the target), it will exit it out.
Great, we are moving forward!
So we know this will try and create a mutex, and the way that mutex’s work, they need to be pretty unique and most developers will name them something special (fact: this is how a LOT of malware samples actually get named).
Looking at the screenshot again, we see that in between it checking for error codes, it pushes a value 0x404cc. This is referencing a place in the memory of the program that holds some data, and it’s putting it on the stack when it’s checking for the mutex. Let’s search this at the top of the window and see what data this holds.
Note: If you search for this, and you are in graph mode it will not display the data (since it’s looking for functions to map out). To display the data, search for the address you’re interested in, and then when you see the error that mentions it cannot display data, hit Space.
Doing this on our address, we see the following:
0x004040ce .string "__CLEANSWEEP__" ; len=15
Awesome! We now know that the mutex name it’s creating/looking for is __CLEANSWEEP__
Looking ahead, we see there is a comparison:

Let’s break down what’s happening here:
- This will run
GetLastError(), which is a C++ function that will return the program’s last error code that’s within the running thread. - Return values from all functions are stored in the
eaxregister in x86 Assembly, which we need to remember since it’s comparingeaxto the hex value0xb7. Cutter lovingly let’s us know that this equals the decimal183. - Checking the Microsoft documentation on this function here and here, we see that that if
183is returned, the error isERROR_ALREADY_EXISTS. - If this condition is met (
jb), it will exit the process, and kill the program.
If you pay attention closely to the last screenshot I shared, Cutter does something that is very helpful and awesome! Within the decompiler, Cutter is smart enough to make some guesses to how functions are coexisting. It knows that it’s trying to run CreateMutex(), and it knows that that it’s checking for an error, so it lovingly labels this decompiled code with the following:
fcn_004013cf("*Dropper*!main : CreateMutex->ERROR_ALREADY_EXISTS");
Awesome! It’s letting us know which function this code is checking and what error it’s checking for! Super neat.
Okay, we have a general idea of these first steps, let’s dig a little deeper!
Digging a Bit Deeper
One of the things that I want to note, but that I’m not totally getting a grasp into what’s going on. Within the entry function, the code runs the following instructions:
xor ebx, ebx
push ebx
call GetModuleFileNameA()
Reading the Microsoft documentation, calling the GetModuleFileNameA() with no parameters will return the path of the executable file of the current process. The xor operation zeroes out the EBX register and the pushes that to the stack to be used by function, so the malware is grabbing it’s own name. It then pushes the return value (push eax) and then prints the file name, PID, and something they label as “BOT_VERSION”.
Let’s look at this code in the graph and decompiler:
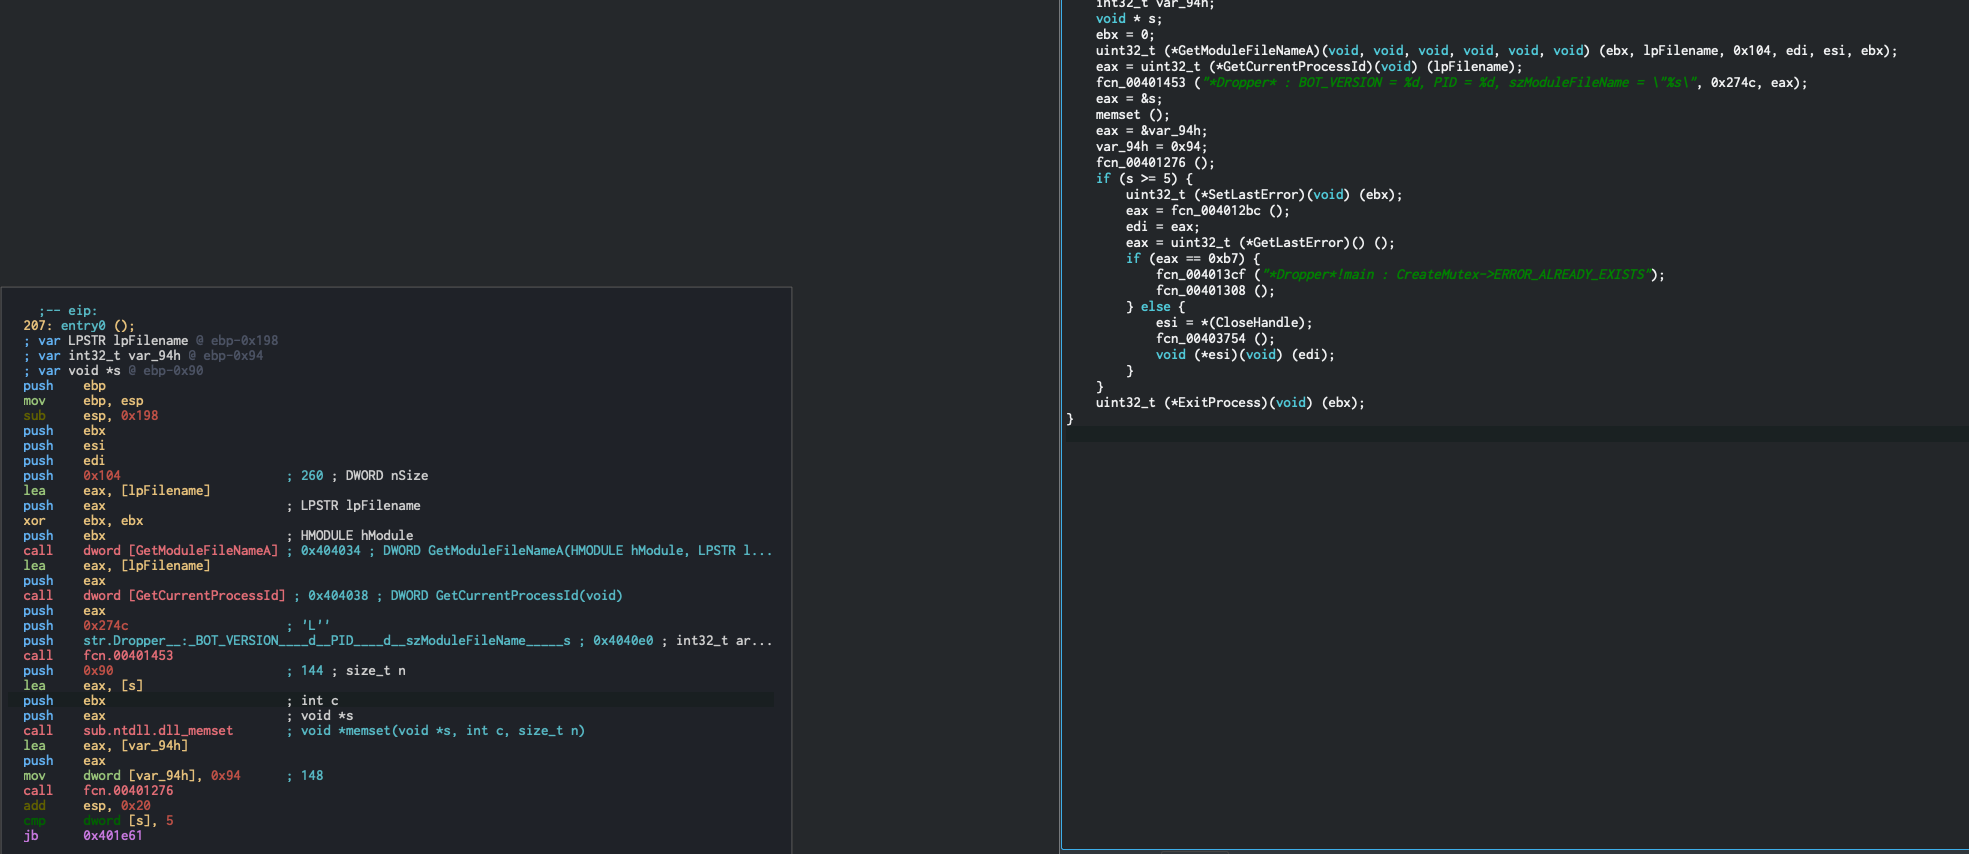
As you can see above, the program pushes the results of GetModuleFileNameA(), GetCurrentProcessId(), and then the value 0x274c, or what we can guess is the BOT_VERSION, in that order. If you notice that the display message prints out BOT_VERSION, PID, and ModuleFileName in that order. The reason for this is that in x86 assembly, the stack grows backwards, so when you are pushing arguments to the stack, you need to put them on in opposite order that they are needed in.
Great, so now we know that there is some self awareness that the malware is getting. Next thing that I did, was basically just look at every call and follow functions around until I found something interesting I could understand (lol). And since this developer had the basic sense to strip all function names, they made analysts lives a bit harder.
Investigating function fcn.00402caa
One of the first functions that I found some interesting content in was fcn.00402caa. This has a couple examples of basic techniques that malware authors implement to hide from antivirus detection and very basic analysis.
At the very beginnning of the function, you see a lot of varaibles being declared, which is one of the first signs that the author will probably attempt to push individual values, likely letters or small strings, to the stack to then form full names. As we go down the code graph we see the following:
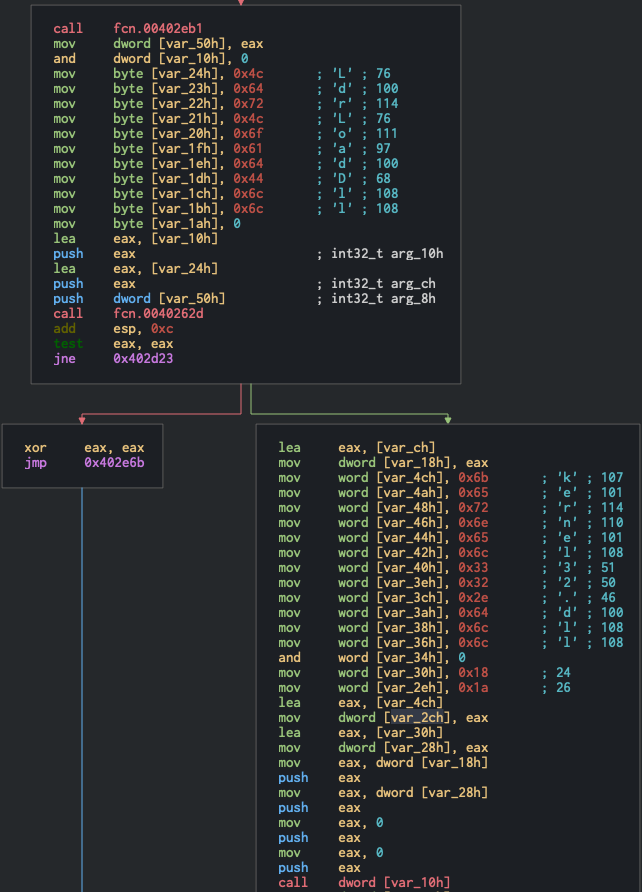
Most reverse engineering applications like Cutter, IDA, and Ghidra will display known strings like you see above, which is super helful to see what is going on at a quick glance. We can see that they are assiging individual letters to variables. The first stack of strings reads out to LdrLoadDll(). This is an interesting function that we will take a second to examine.
As the name will pretty much tell you, this is a method in Windows, to load a DLL into memory to then use. The unique concept about this, is that this is not the normal process of doing this. There are very well documented API’s to do this very thing (see LoadLibaryExA(), or even just LoadLibrary() among others). These have very good documentation on the MSDN developer site, whereas LdrLoadDll() has zero documentation on the official MSDN site. This is because this API is a very low level function that will load DLL’s into a process. The LoadLibrary() family of functions are essentially just wrappers that implement LdrLoadDll() and make it a little easier and more robust for users to execute. The reason the author chose to use this function, is to avoid further detection. Loading DLL’s, paired with a few other API’s, is very well signatured to be malware behavior. If the author opted to just use LoadLibrary() along with the other functions they are using, they would have a higher change of getting picked up by more advanced antivirus programs.
So the use of LdrLoadDll(), along with the fact that they aren’t explicitly calling this function, but rather stacking the letters on the memory stack to then, assumably, get concatonated together is very telling of the intent of the author (if it wasn’t clear already!).
Moving down the code graph, we then see another set of strings being split and pushed onto the stack, now spelling out kernel32.dll. Again, this is a legitamate DLL to use, but it contains a lot of functions that, when paired with other behaviors of this code, will start getting flagged as malicious. The being placed on the stack directly after LdrLoadDll() makes it very apparent what’s going on in this function. Another interesting find I needed some help with, so I called in a coworker to help me look at, as they have way more experience with this kind of stuff. Here is was I saw, still within fcn.00402caa:
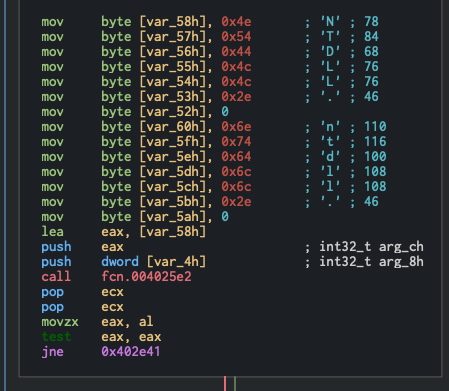
So this is still within the context of the LdrLoadDll(), and my first thought they were loading in NTDLL.dll along with the other files, but if you look closely, they stack the string “NTDLL” and “ntdll”. The first thing we may have thought was that the null termination (push 0) after putting the first set of letters, would have implied to load NTDLL.dll. That didn’t turn out to be the case, and then we finally came to the conclusion that this may have been a mistake, that the author meant to push NTDLL.dll but instead they pushed NTDLL.ntdll. You would think that this would cause an error that would be notable and the author would have to fix it, since that’s not a valid file and they clearly want some of the functions inside of NTDLL.dll. But we later discovered that NTDLL.dll is loaded with all Win32 applications by default, so even though it wouldn’t have loaded properly the way they wanted, but they could still use functions inside of this file. Pretty interesting to see the mistakes malware developers make, they are human after all!
Great, this function is throughly vetted, let’s move on to another interesting one!
Process Injection
So I found myself at function fcn.00403469, which I got to by looking at the different imports and noticed a few API’s that tipped me off into something the author implemented in this malware. The act of process injection is, simply, getting a handle on another running process on the system, allocating some free memory in that process, writing whatever you’d like in that allocated memory, and then creating a thread in that process to then run what you need it to, hopefully leaving the process running and stable while it’s running your code along with it’s intended code.
This is a very well documented and signatured vector, that uses these 4 API’s in the most common instances: OpenProcess(), VirtualAllocEx(), VirtualProtectEx(), WriteProcessMemory(), CreateRemoteThread(). If a function contains these API’s together, even if it’s truly legitimate, it will more than likely be flagged for being malware, since it’s so prevelent. I noticed that a couple of these API’s were called in this particular sample, so I followed the references to those, which landed me at fcn.00403469.
So within this function (which I renamed to procInject) we see the following:
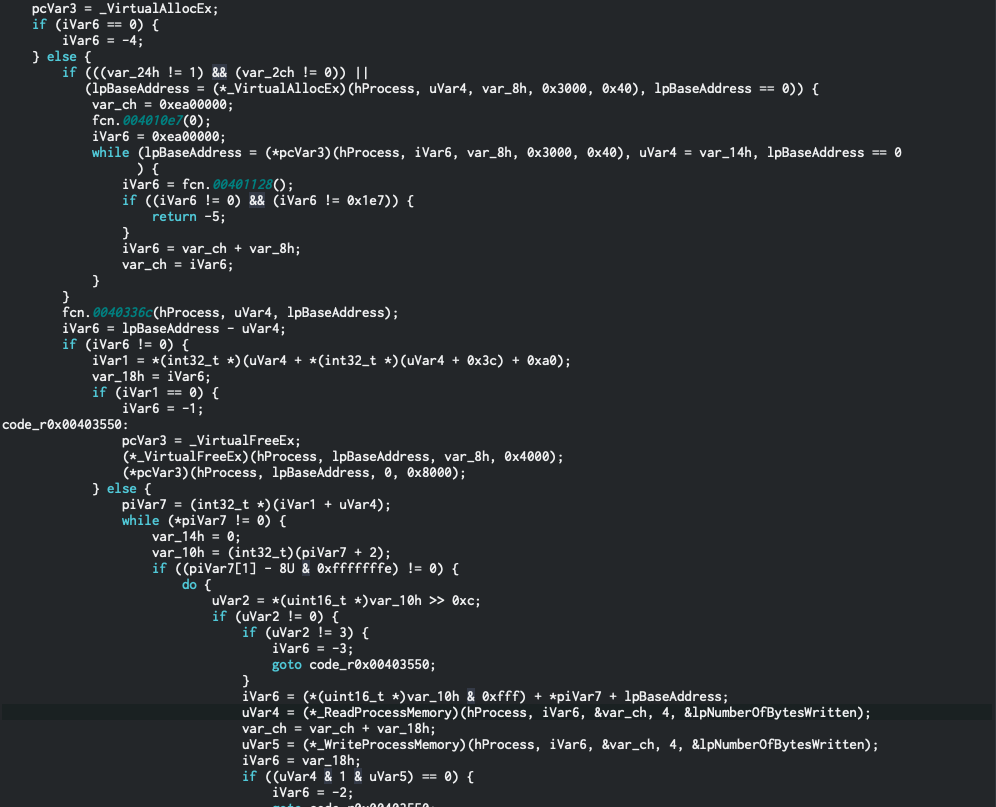
As seen above, if you look close enough, you can see the decompiler that all the classic API’s are hit for process injection. The missing vector that we don’t know is what process this is trying to inject to. And this took me admittedly a long time to figure out, but we need to look at the top of this procInject function, to see if it takes any parametrs. Looking at the definition of this process, you can see that it does in fact take a parameter called hProcess. This is the common parameter that the API’s required for process injection, which is an open handle to a process that you want to get info about, and ultimately inject into.
Great, so we know that this function will inject into a remote process, which is defined as this process is called. Let’s see if we can find out what process the author is trying to inject into (the hard, yet fun part!)
Finding Process to Inject Into
So to find out what process the author is trying to inject to, I first looked at the function that calls the procInject function.
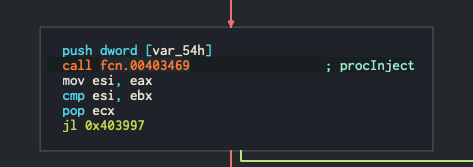
So my first attempt at this was trying to follow the variable that is pushed to the stack right before calling the procInject function, which was very, VERY difficult for me. My little expereince with this kind of reversing, and my rudimentary grasp on decompiled C code really showed with this!
My next thought process was this: The author needed to open a handle to SOME process in order to do this, you need to grab this in some way. So I went to the string window within Cutter and just searched for the term “proc” to see what I could find, hoping to see something like OpenProcessA() or something like that.
I didn’t find this API, but I did find Process32Next which peaked my interest. This API is very similar to CreateToolhelp32Snapshot, which gets a snapshot of currently running processes on a windows system (which you can imagine would be a good thing to use for malware authors >:) ).
Process32Next is documented as being able to get info about the next process recorded within a snapshot. So even though I don’t know how or where the author is getting a snapshot, I know how they are going through a snapshot they have taken, awesome!
So I look for the Cross Referenced (X-ref) of this memory address holding the string Process32Next and find out where it’s being used, and find it! Once again, my inexpereince shines through and I’m not too sure what to make of this function, but I know that I’m onto something. So just because I don’t know what this function does, let me see where this function is being used. I go up to the function name and look at this functions X-ref’s, and find that it’s being called back at the entry point we were at in the beginning!
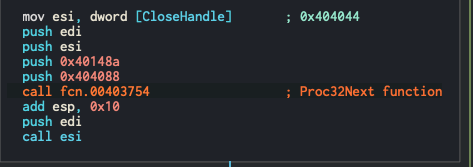
As seen above, I added a comment so I know what this function generally does, and you can see that two other strings are being pushed to the stack before calling this function. As I looked at these I found the key to our puzzle!

Woo! We see that at this memory location, the string explorer.exe is being defined. So we can guess (which I do a lot while reversing, since I can’t ultimately figure it all out…yet), that this program takes a snapshot, it will loop through this snapshot until it finds explorer.exe, and then get a handle on this process, and inject something into and execute it! Nice!
Conclusion
Of course there is so much more to figure out with this sample. What is it injecting into this process, what do all the other functions do? Plus there is the step of doing dynamic analysis. This blog post is getting pretty lengthy, but I think if there is some interest generated, I will continue with this sample, starting out with figuring out the payload being written to the remote process!
Thanks for sticking to the end if you made it here, please let me know if this is of any interest of you and if you’d like more! Hit me up on Twitter with any feedback, I’d love to hear your thoughts.
~ Hack the planet! ~
